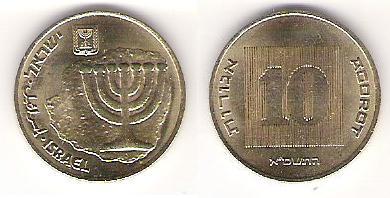
10 agorot
Numismatic Value Guide: Discover Your Coin’s True Worth by Grade
Wondering how much your coin might be worth? In the world of numismatics, a coin’s value is influenced by more than just its metal content—factors such as condition, rarity, historical significance, and collector demand all play a crucial role. Even small differences in wear, strike quality, or preservation can have a major impact on market value. Use the grading table below, which ranges from circulated grades (Good, Fine) to top-quality uncirculated coins (Mint State, Proof), to better understand the potential worth of your coin. You might be surprised to learn how a well-preserved example can be worth several times more than a heavily circulated one.
| Year | Coins | Mint | UNC | XF | VF | F | VG | G | PR |
|---|---|---|---|---|---|---|---|---|---|
| 1984 | Daejeon | ||||||||
| 1985 | 45.000.000 | Sttutgart | 1$ | ||||||
| 1985 | 45.000.000 | Jerusalén | 2$ | ||||||
| 1986 | 20.934.048 | Jerusalén | 0.45$ | 0.27$ | 0.15$ | 0.12$ | 0.11$ | 0.1$ | |
| 1986 | 71.820.000 | Berna | 0.14$ | ||||||
| 1987 | 19.351.382 | Jerusalén | 3$ | 0.85$ | 0.31$ | 0.18$ | 0.15$ | 0.13$ | |
| 1988 | 8.640.298 | Jerusalén | 0.27$ | 0.1$ | 0.08$ | 0.06$ | |||
| 1989 | 420.000 | Jerusalén | 0.3$ | ||||||
| 1990 | 2.376.000 | Jerusalén | 0.95$ | 0.44$ | 0.3$ | 0.26$ | 0.23$ | ||
| 1991 | 11.905.000 | Jerusalén | 4.35$ | 2.25$ | 1.16$ | 0.83$ | 0.75$ | 0.67$ | |
| 1991 | 30.240.000 | Santiago de Chile | 24.72$ | 4.61$ | 0.86$ | 0.37$ | 0.28$ | 0.21$ | |
| 1992 | 1.728.000 | Jerusalén | 0.67$ | 0.37$ | 0.2$ | 0.15$ | 0.13$ | 0.12$ | |
| 1993 | 25.920.000 | Santiago de Chile | 0.19$ | ||||||
| 1994 | 21.600.000 | Sttutgart | 1.05$ | 0.14$ | 0.07$ | 0.04$ | |||
| 1994 | 30.096.000 | Utrecht | 0.14$ | ||||||
| 1995 | 17.280.000 | Kongsberg | 1.1$ | 0.68$ | 0.53$ | 0.42$ | 0.37$ | 0.36$ | 0.34$ |
| 1996 | 43.200.000 | Santiago de Chile | 0.69$ | 0.34$ | 0.16$ | 0.11$ | 0.1$ | 0.09$ | |
| 1997 | 21.600.000 | Kongsberg | 19.56$ | 2.26$ | 0.26$ | 0.09$ | 0.06$ | 0.04$ | |
| 1997 | 21.600.000 | Utrecht | |||||||
| 1998 | 60.480.000 | Santiago de Chile | 2.98$ | 0.8$ | 0.41$ | 0.21$ | 0.15$ | 0.14$ | 0.12$ |
| 1999 | 21.600.000 | Jerusalén | 2.6$ | 0.46$ | 0.26$ | 0.14$ | |||
| 1999 | 4.601.000 | Daejeon | 0.45$ | ||||||
| 2000 | 82.944.000 | Santiago de Chile | 0.3$ | ||||||
| 2001 | 32.256.000 | Santiago de Chile | 0.73$ | 0.33$ | 0.15$ | 0.1$ | 0.09$ | 0.08$ | |
| 2001 | 46.140.000 | Seúl | |||||||
| 2002 | 4.608.000 | Varsovia | 0.45$ | ||||||
| 2003 | 22.980.000 | Seúl | |||||||
| 2004 | 37.198.272 | Daejeon | 0.5$ | 0.35$ | 0.24$ | 0.2$ | 0.19$ | 0.18$ | |
| 2005 | 41.200.000 | Jerusalén | 0.15$ | ||||||
| 2006 | 43.800.000 | Daejeon | 0.12$ | ||||||
| 2007 | 39.800.000 | Daejeon | 0.33$ | 0.21$ | 0.16$ | 0.13$ | 0.11$ | 0.11$ | 0.1$ |
| 2008 | 50.700.000 | Daejeon | 0.17$ | 0.14$ | 0.14$ | 0.13$ | |||
| 2009 | 37.500.000 | Daejeon | 0.15$ | ||||||
| 2010 | 53.400.000 | Daejeon | 0.21$ | 0.16$ | 0.13$ | 0.11$ | 0.11$ | 0.1$ | |
| 2011 | 33.200.000 | Daejeon | 2.1$ | 0.56$ | 0.15$ | 0.08$ | 0.06$ | 0.05$ | |
| 2012 | 94.000.000 | Daejeon | |||||||
| 2013 | Daejeon | 0.36$ | |||||||
| 2014 | Daejeon | 0.19$ | 0.18$ | 0.17$ | 0.16$ | 0.16$ | 0.16$ | ||
| 2015 | Daejeon | 1.43$ | 0.55$ | 0.21$ | 0.13$ | 0.11$ | 0.09$ | ||
| 2016 | Daejeon | ||||||||
| 2017 | Daejeon | 0.4$ |